Your storefront
Reports
Your sales over time, what sells best, how customers pay, your profit, and a daily summary for cashing up.
In the consoleGrow → Reports
Home gives you the headline numbers. Reports goes deeper, for any date range you choose, and compares it with the period before.
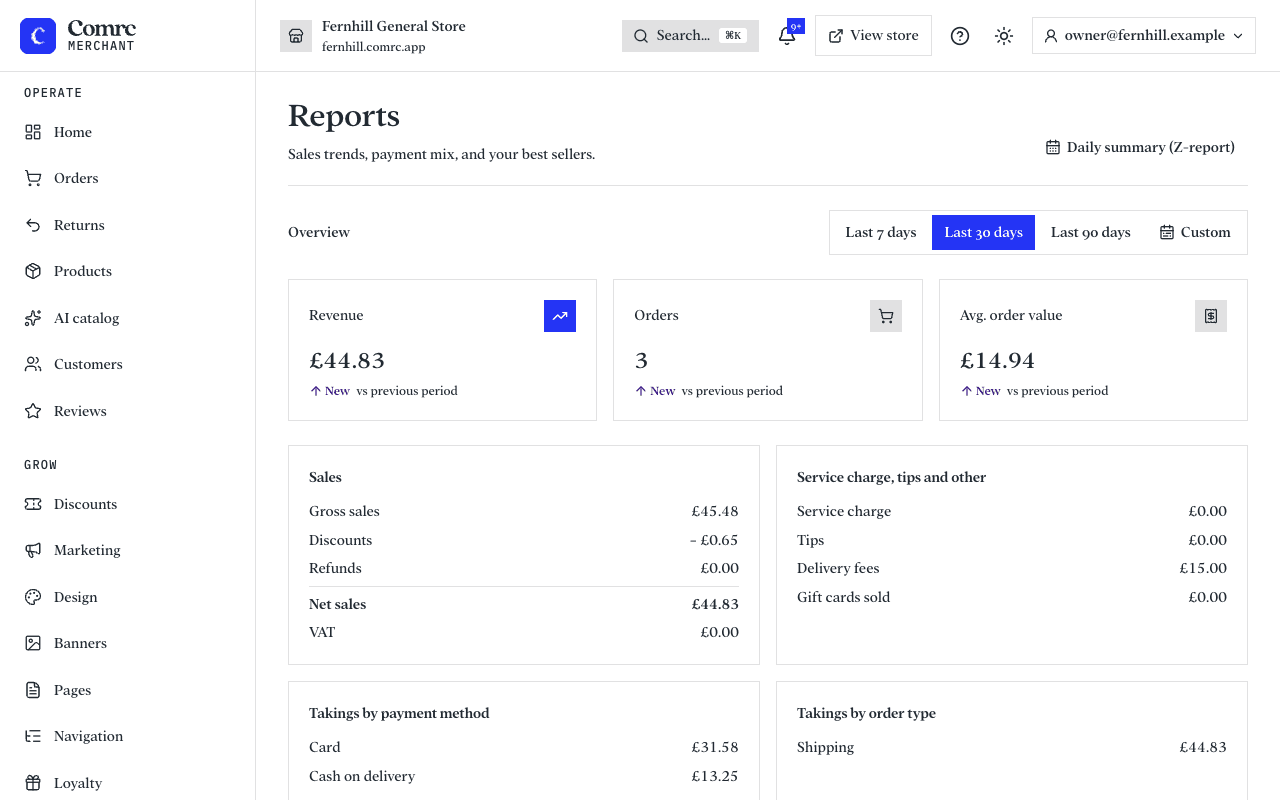
What you'll find
- Revenue over time, with the change against the previous period.
- Sales — gross sales, discounts, refunds and net sales, and the VAT in them.
- Takings by payment method, and by order type.
- Top sellers, by units sold. Export CSV downloads the table.
- Gross profit and margin, from your net sales and the cost of what you sold.
Getting profit right
Profit uses each product's cost price. A product without one isn't counted, and the report tells you how many units that affects. Add cost prices on your products to include them. Customers never see a cost price.
The daily summary
The daily summary, or Z-report, is one day's takings on one page: sales, VAT, payment methods, and for food businesses service charge and tips, listed separately so you can share them out. Step between days and print it.